Monitoring with Prometheus, Loki, and Grafana
This page describes how to stand up a sample OpenCue deployment configured to send data to external monitoring services.
The sandbox deployment described here utilizes:
- Prometheus for collecting metrics from the OpenCue database and scheduler.
- Loki for collecting logs from all OpenCue components.
- Grafana to provide an interface for querying and displaying the data send by the others.
Before you begin
- Follow our quick start guide, which will walk you through standing up a basic OpenCue deployment using Docker compose. This guide builds on the quick start, and they share the same prerequisites.
- Install the Loki Docker driver.
Deploying OpenCue with external monitoring services
You deploy the sandbox environment using Docker Compose, which runs the following containers:
- a Prometheus exporter that queries the OpenCue API for system stats
- a Prometheus exporter for PostgreSQL server metrics
- a Prometheus instance for metrics storage
- a Loki instance for log storage
- a Grafana instance
- the same OpenCue components deployed in the quick start, configured to send logs to Loki
To deploy the sandbox environment:
-
If you followed the first quick start before this one, ensure all resources are cleaned up .
-
Start the Terminal app.
-
Change to the root of the OpenCue source code directory:
cd OpenCue -
To deploy the sandbox environment, run the
docker-composecommand:docker-compose --project-directory . -f ./docker-compose.yml -f sandbox/docker-compose.monitoring.yml upThe command produces a lot of output. When the setup process completes, you see output similar to the following example:
rqd_1     | 2019-09-03 16:56:09,906 WARNING   rqd3-__main__   RQD Starting Up
rqd_1     | 2019-09-03 16:56:10,395 WARNING   rqd3-rqcore     RQD Started
cuebot_1  | 2019-09-03 16:56:10,405 WARN pool-1-thread-1 com.imageworks.spcue.dispatcher.HostReportHandler - Unable
 to find host 172.18.0.5,org.springframework.dao.EmptyResultDataAccessException: Failed to find host 172.18.0.5 , c
 reating host.
Leave this shell running in the background.
Using Grafana to view exported data
To view the data exported by the monitoring stack, log into the Grafana endpoint provided by the sandbox environment.
-
Open your browser and visit http://localhost:3000/.
-
Log in with the default admin account:
- User: admin
- Password: admin
-
Change the
adminpassword if prompted. -
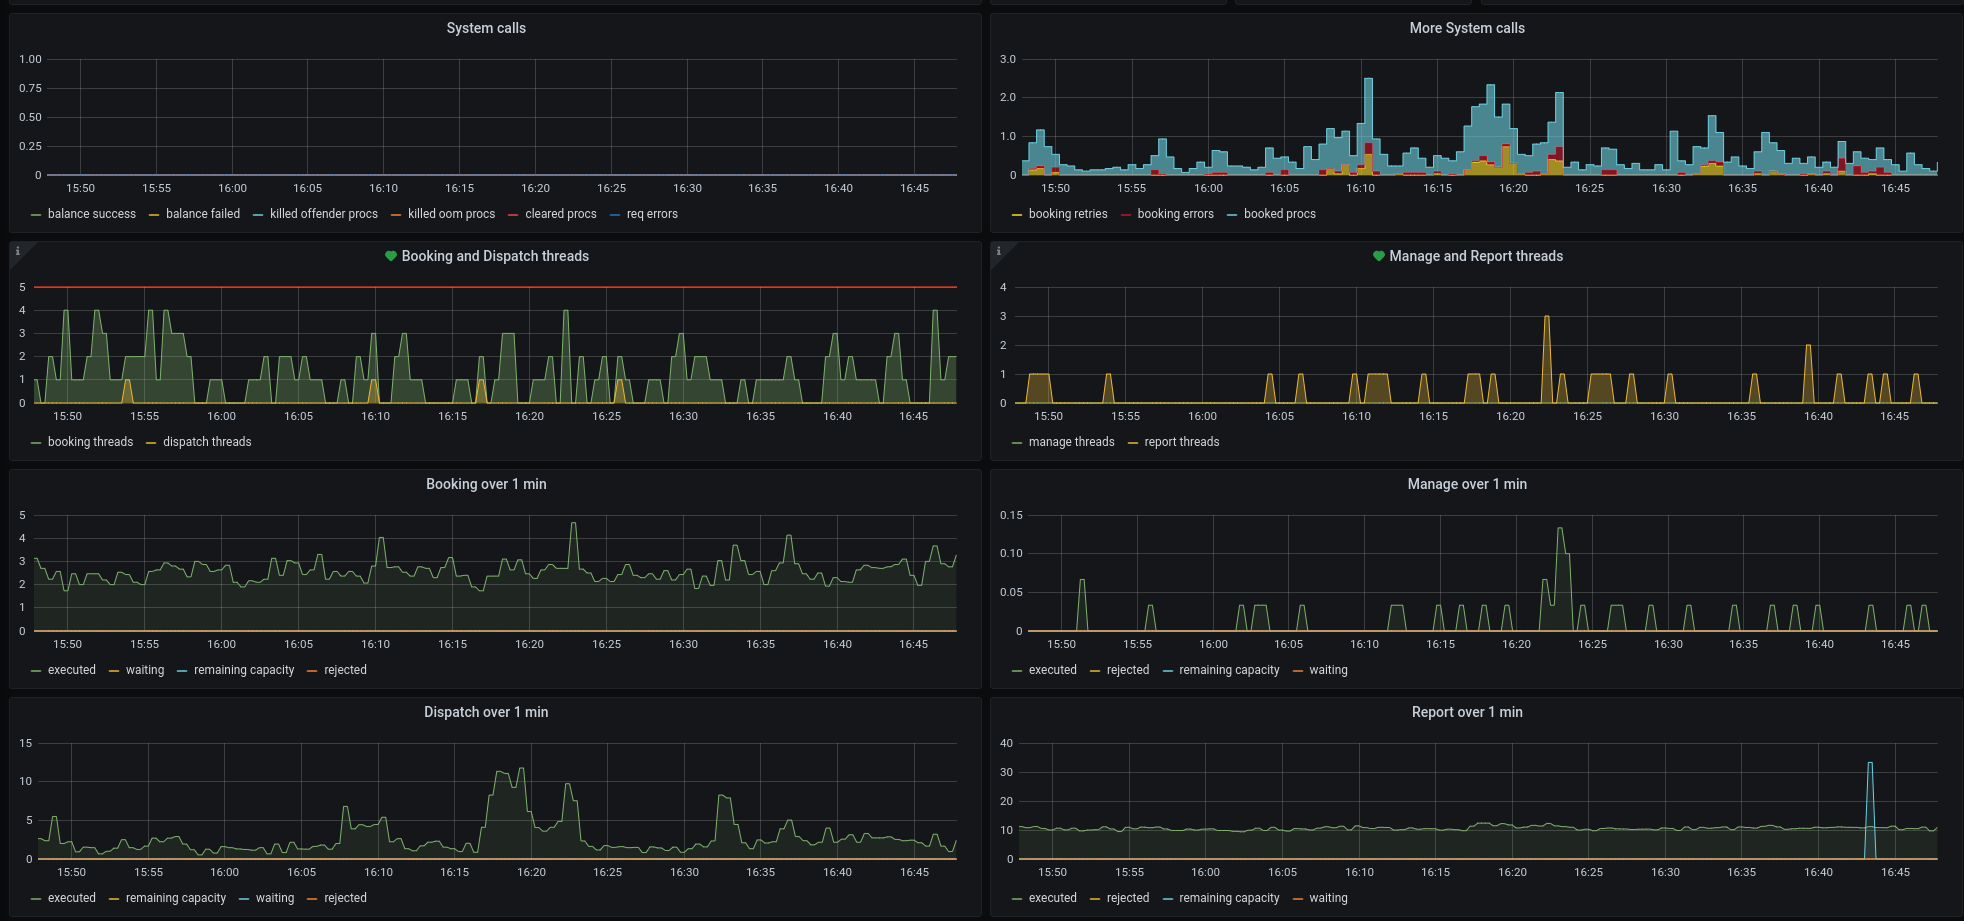
To view the sample dashboards included with the sandbox, click Dashboards > Manage.
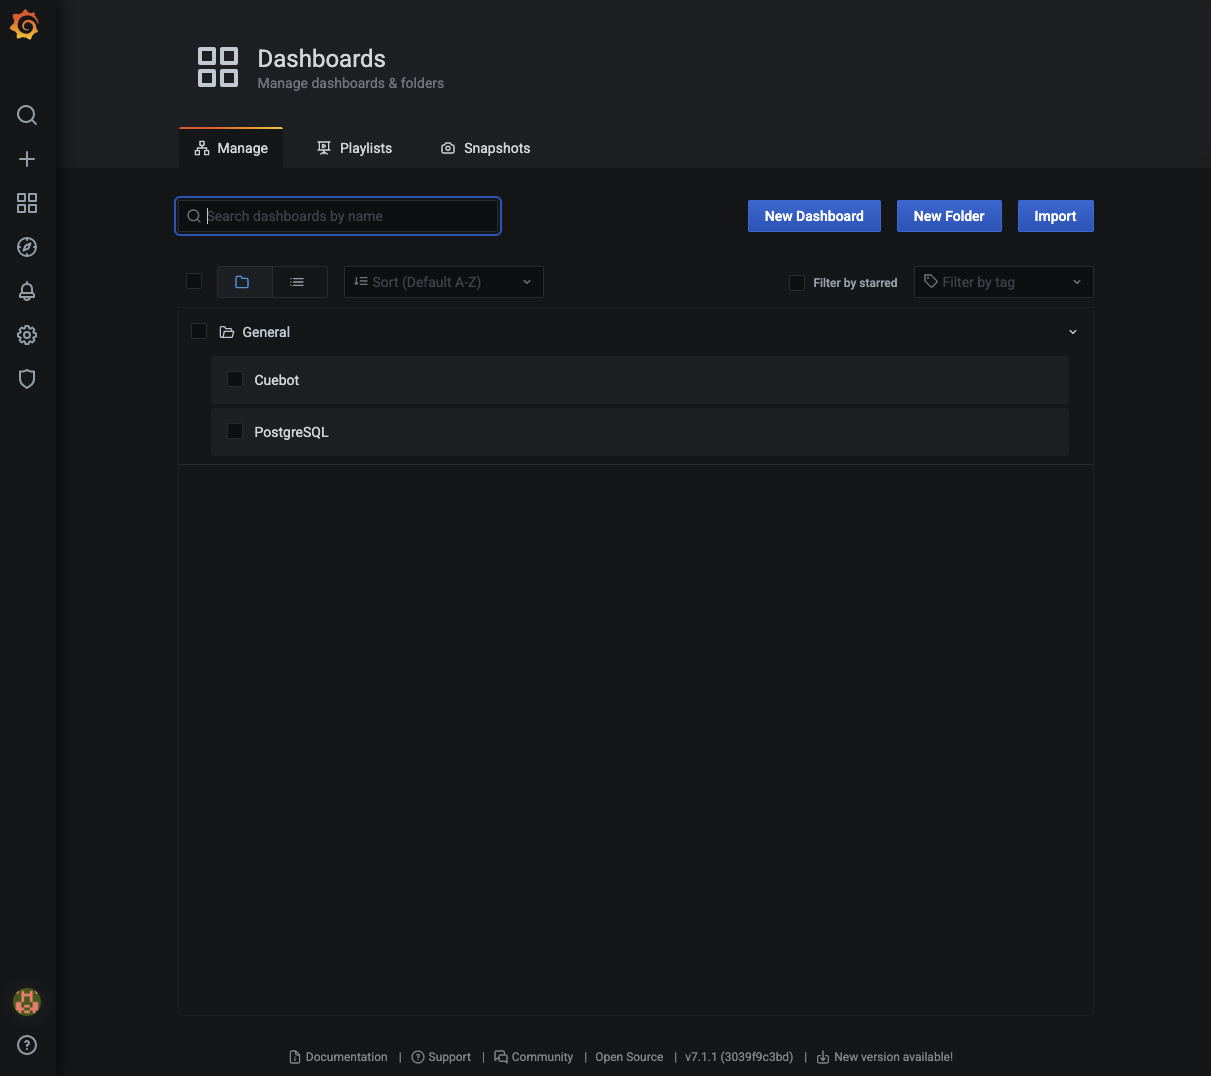
Once displayed, these dashboards will show metrics exported from Cuebot and the PostgreSQL database:
Customizing exported data
The OpenCue repository contains a few key files that can be used as examples for your own deployment:
- Our custom Prometheus exporter that uses the OpenCue API to fetch metrics from the Cuebot.
- The example Cuebot and PostgreSQL dashboards .
Stopping and deleting the sandbox environment
To delete the resources you created in this guide, run the following commands from the second shell:
-
To stop the sandbox environment, run the following command:
docker-compose --project-directory . -f ./docker-compose.yml -f sandbox/docker-compose.monitoring.yml stop -
To free up storage space, delete the containers:
docker-compose --project-directory . -f ./docker-compose.yml -f sandbox/docker-compose.monitoring.yml rm -
To delete the PostgreSQL data directory created by the database setup process:
rm -rf sandbox/db-data
What’s next?
- Explore Grafana’s functionality using the Grafana Getting Started guide.
- Install the full OpenCue infrastructure.
Feedback
Was this page helpful?
Glad to hear it! Please tell us how we can improve.
Sorry to hear that. Please tell us how we can improve.